
As I’ve mentioned a couple times now, the main job of CALCULATE is to create a new Evaluation Context where filters have been added or removed, and then run whatever has been typed into argument 1 (the “New Filters Formula”) *within* that new Evaluation Context. Essentially running the “New Filters Formula” within a new set of filters.
So far I’ve shown you the basics of using argument 2 of CALCULATE in different ways to either add or remove filters. However, there’s another important way you can add a filter with CALCULATE that has nothing to do with argument 2. It’s hard to remember but thankfully pretty easy to learn; and its name is “Context Transition”.
Why We Need Context Transition
Let’s start by working through a Measure that’s broken. Everyone will write a variation of this measure at least 20 times in their career before they start getting a tactile sense of what they are doing wrong.
We’re working with our standard Data Model:
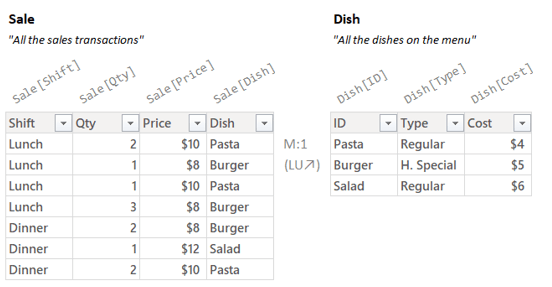
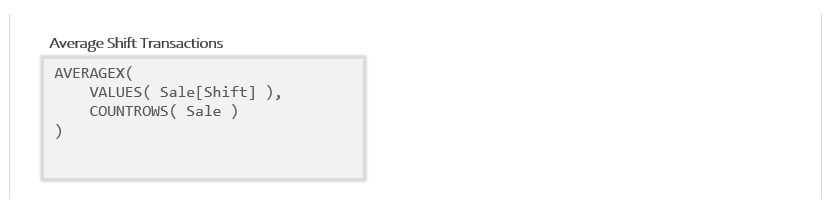
The name of the Measure we’re building is “Average Shift Transactions”. As the name implies, it should find the average number of transactions (rows) across both of our shifts. Since there are 4 rows for “Lunch” and 3 rows for “Dinner”, we should expect to get 3.5 (the average of 3 and 4).
Easy, right?
Let’s look at our first draft:
(which, to be clear, does not yet work correctly)
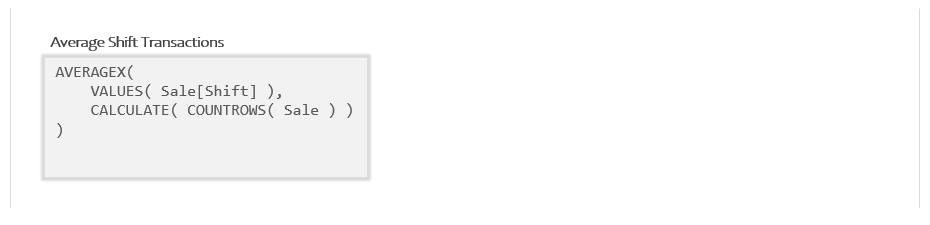
Average Shift Transactions =
AVERAGEX(
    VALUES( Sale[Shift] ),
    COUNTROWS( Sale )
)
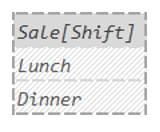
So the basic idea with this Measure is that it should start by using VALUES to get a Temp Table with rows for both of our two shifts:
AVERAGEX then takes that Temp Table and runs the following Per Row Formula for each row:
COUNTROWS( Sale )
So a very simple conceptualization of what we’re hoping will happen might look like this:
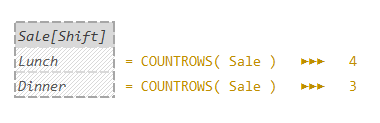
We can see the Per Row Formula running for each row. When the Per Row Formula runs for the top row, it should count the number of “Lunch” rows and get “4”; and then when that same Per Row Formula runs for the bottom row, it should count the number of “Dinner” rows and get “3”.
Then AVERAGEX should average those two numbers (“3” and “4”) to get “3.5”.
That’s what we *want* it to do.
But something clearly isn’t working, because once we drag it onto a visual, instead of “3.5” we get “7”:
Our code looks like it should work, and actually it is painfully close to being correct.
Fixing it will be very fast, but before we do that, it’s important to get a tactile sense of *why* the above isn’t working, As you might guess, to do that we’re going to perform a decomposition.
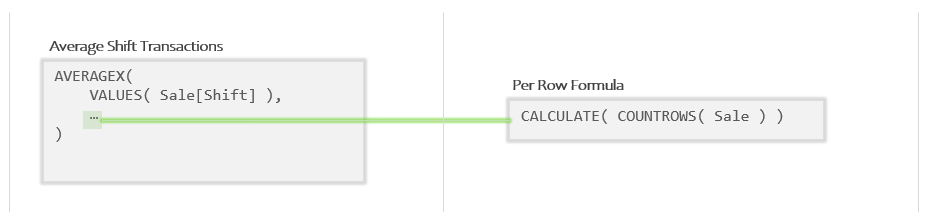
Let’s start with the entire Measure in a little box:
Since AVERAGEX is an Iterator, that means argument 2 is a Per Row Formula. Let’s decompose what we have above to pull the Per Row Formula out into its own little box:
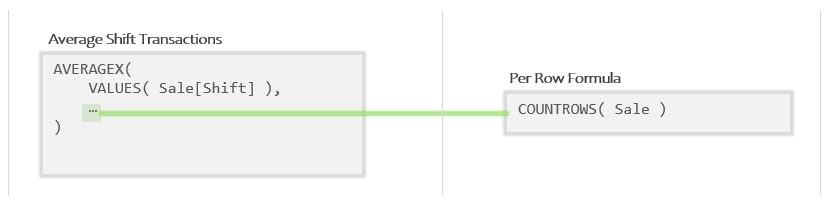
OK, so that code in the second box is the sub-formula that will run “once per row” of the Temp Table that VALUES produces.
In the left panel, let me draw in both the initial Evaluation Context and that Temp Table from VALUES:

(I’ve zoomed out to give us some space; we’ll be needing it in a minute.)
Mechanically, running “once per row” means AVERAGEX will use both rows of that Temp Table to create a *pair* of new Evaluation Contexts to run the Per Row Formula in. Each of the new Evaluation Contexts will have the values of one of the rows added into the Row Context.
We’ll worry about what running the “Per Row Formula” looks like in a second, let me start by just drawing in the two Evaluation Contexts created by AVERAGEX:
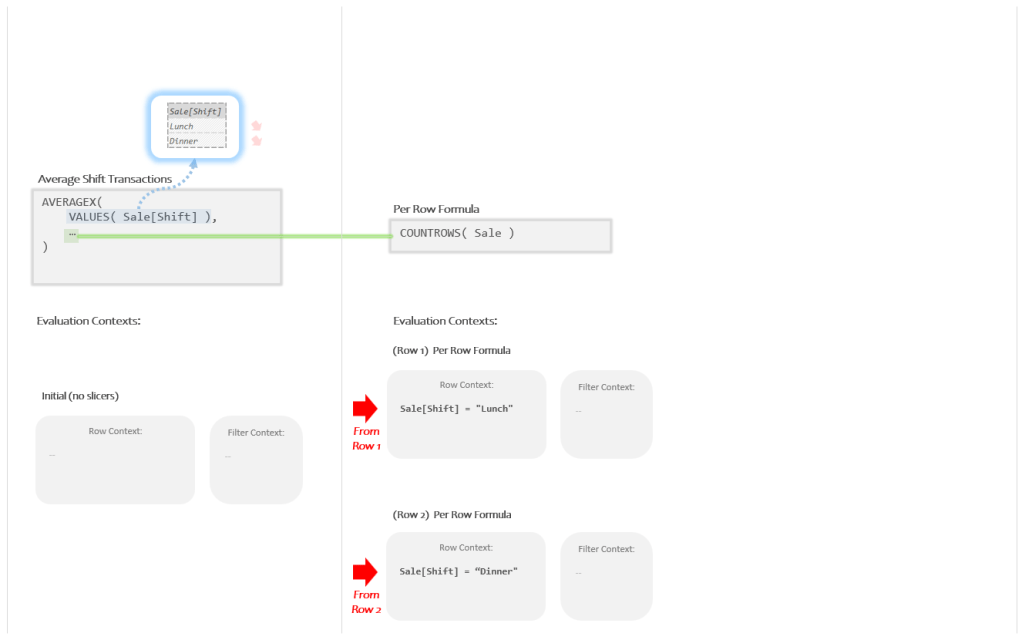
So AVERAGEX created one Evaluation Context with a Current Row Value of “Lunch” and another Evaluation Context with a Current Row Value of “Dinner”.
(Recall that “Current Row Value” is just my fancy name for each item in the Row Context.)
It now runs the Per Row Formula in each of those Evaluation Contexts to get the numbers it will average.
The Per Row Formula is pretty simple:
COUNTROWS( Sale )
When that runs, COUNTROWS is expecting a Temp Table and we are giving it a Model Table. To do the conversion for us DAX takes the Auto Snapshot of “Sale”. DAX will get a copy of “Sale” as a Temp Table, the Super Lookup will add all Related columns, and Auto Filtering will filter things down.
What most folks expect at this point is that for the top “Lunch” Evaluation Context we will get a Temp Table with only “Lunch” rows, and for the bottom “Dinner” Evaluation Context we will get a Temp Table with only “Dinner” rows.
That, however, is not what happens:
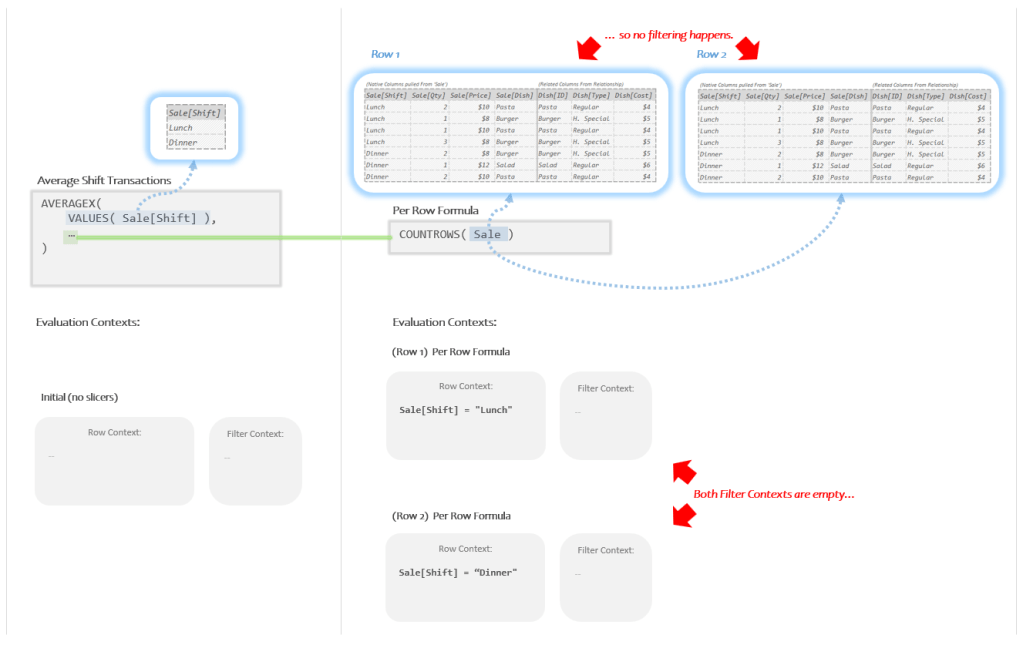
For both Evaluation Contexts we get 7 rows and clearly no filtering has happened. But why?
Since I’m showing you the image above, the answer is not that difficult to see. In each of the Evaluation Contexts the Filter Context is *empty*. Since we never actually put anything in the Filter Context, when the Auto Snapshot happens there are zero filters to apply.
To put it succinctly:
“no filters” = “no filtering”
You might think that DAX should just be smart enough to take the Current Row Values of “Lunch” and “Dinner” and automatically convert them into filters, but DAX simply does not do that.
Unless of course… we tell it to.
More on that ominous note in a second; but first let’s quickly finish up our example:
So for both times the Per Row Formula runs above, it produces a Temp Table with “7” rows, which is then counted by COUNTROWS. Therefore the Per Row Formula will return “7” for the top row and “7” for the bottom row.
AVERAGEX gets the numbers “7” and “7”, averages them together to comes up with (you guessed it) “7”.
That’s where our card gets its incorrect answer:

OK, so now we at least have a sense of what isn’t working with our bad version:
Each row’s values of “Lunch” and “Dinner” were added to the Row Context for the Per Row Formula to run in; but those values being in the Row Context is not enough for them to act like filters. To get the correct behavior we have to somehow get those values out of the Row Context and into the Filter Context.
It’s almost like we have to “transition” them from one context to another.
Let’s go find out how we do that.
CALCULATE to the Rescue
New DAX authors will often hear that if your code isn’t working, simply try adding CALCULATE to it. In reality, there are many, many scenarios where this approach will either do nothing at all or make things worse. However, for the *particular* scenario described in the last section, it is the exact remedy we need.
All we have to do is take our old Per Row Formula:
COUNTROWS( Sale )
and wrap the whole thing in CALCULATE like so:
CALCULATE( COUNTROWS( Sale ) )
That’s it. Like magic it will suddenly work correctly.
So here’s the working version in its entirety:
Average Shift Transactions =
AVERAGEX(
    VALUES( Sale[Shift] ),
    CALCULATE( COUNTROWS( Sale ) )
)
Again, the only difference here is that our Per Row Formula includes a CALCULATE function wrapped around everything we had before.
Note that there is no second argument to CALCULATE; so it *looks* like what we have is a New Filters Formula where we *forgot* to type in extra arguments telling CALCULATE how we want the filters to be different. If we don’t tell CALCULATE how to change the filters, one would assume the filters don’t change at all. Right? That’s what I’d think. This feels like it shouldn’t behave any differently than the broken version we examined in the last section.
And yet when we look at it in Power BI, it somehow (maddeningly) works:

I could try and talk through how CALCULATE is fixing things here, but frankly, it’ll make the most sense if we just dive into decomposing this new version.
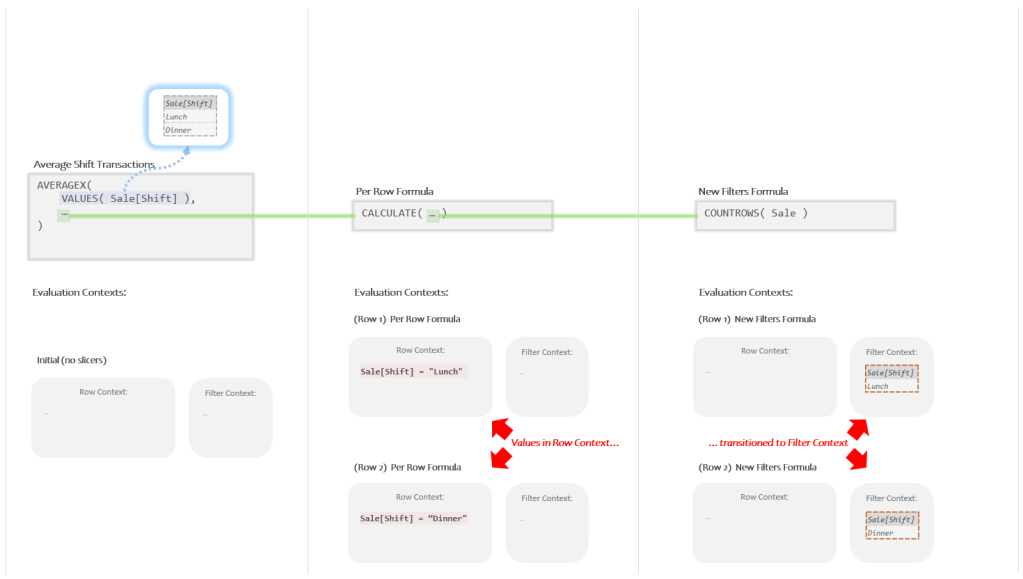
Start with the whole thing in a box:
Let’s pull the Per Row Formula out into a separate box:
Which is a good start, but if you look at the Per Row Formula you will notice that inside CALCULATE is a New Filters Formula. In other words our sub-formula contains a second sub-formula.
Let’s pull that sub-sub-formula out into its own separate box so our Measure is fully decomposed:
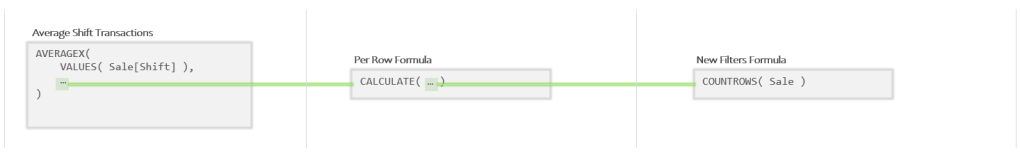
So to restate, what we have in this Measure is a sub-formula that contains its own sub-formula.
In the far right is the “New Filters Formula” which is a sub-formula of the “Per Row Formula”, which itself is a sub-formula of the main formula.
Not only is something like this allowed, it is actually quite common. As you get better with DAX you will be able to keep track of sub-formula chains that can go for several layers. This time, it’s just the three layers. Which is plenty to start.
For just the first panel (far left) let’s add in the Evaluation Context and the Temp Table produced by VALUES:
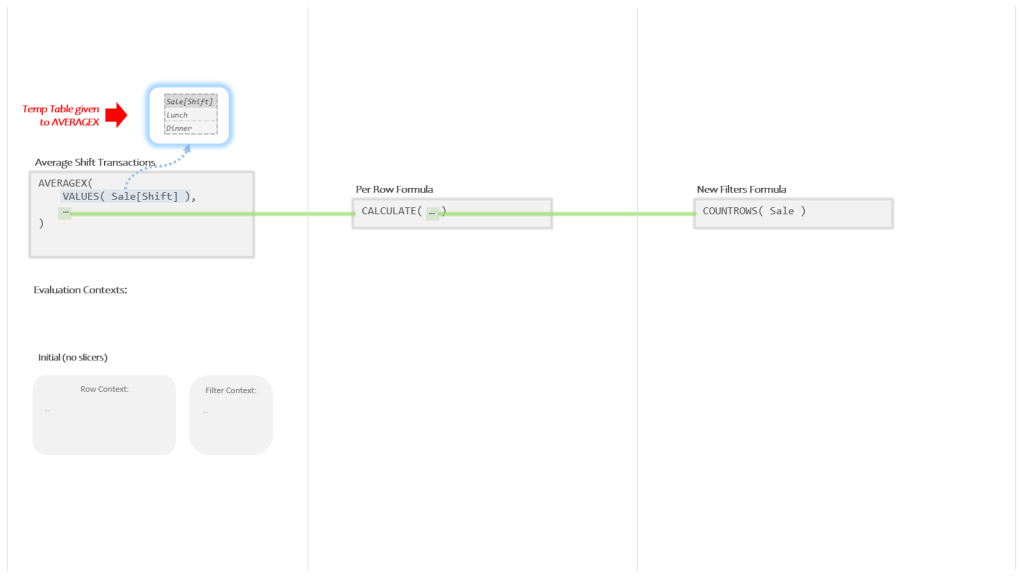
So AVERAGEX is going to take the Temp Table produced by VALUES and use it to create two new Evaluation Contexts for the Per Row Formula to run in:

Just like before, the Evaluation Context for the top row has a Current Row Value of “Lunch”, and the Evaluation Context for the bottom row has a Current Row Value of “Dinner”.
Consider the Per Row Formula in that middle panel:
CALCULATE( … )
We aren’t giving CALCULATE any additional arguments that describe how we want the filters to be different. Since we aren’t providing any changes we want made to the filters, won’t the filters be the exactly the same as before?
They will not.
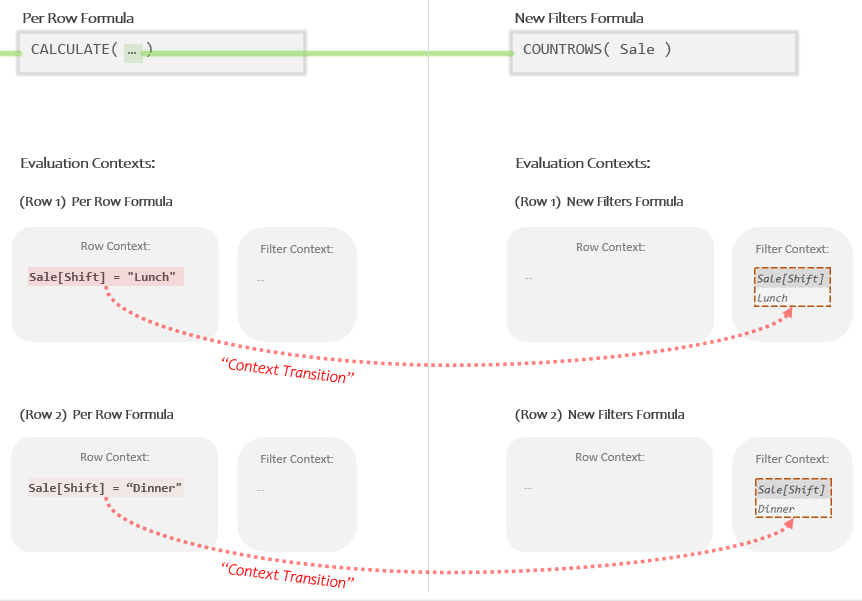
One of the most important things CALCULATE *automatically* does when building new Evaluation Contexts is to take any values in the Row Context, package them up as a Temp Table, and move them into the Filter Context.
This behavior is called Context Transition.
“Context Transition” sounds scary, but is essentially nothing more than:
(1) Pick up the stuff in the old Row Context
(2) Convert it to a Temp Table
(3) Drop it in the new Filter Context
That’s it. Move all the stuff from one context to another. Simple.
This may seem a little vague still, but will make sense when we can actually see the behavior in our image. Speaking of which…
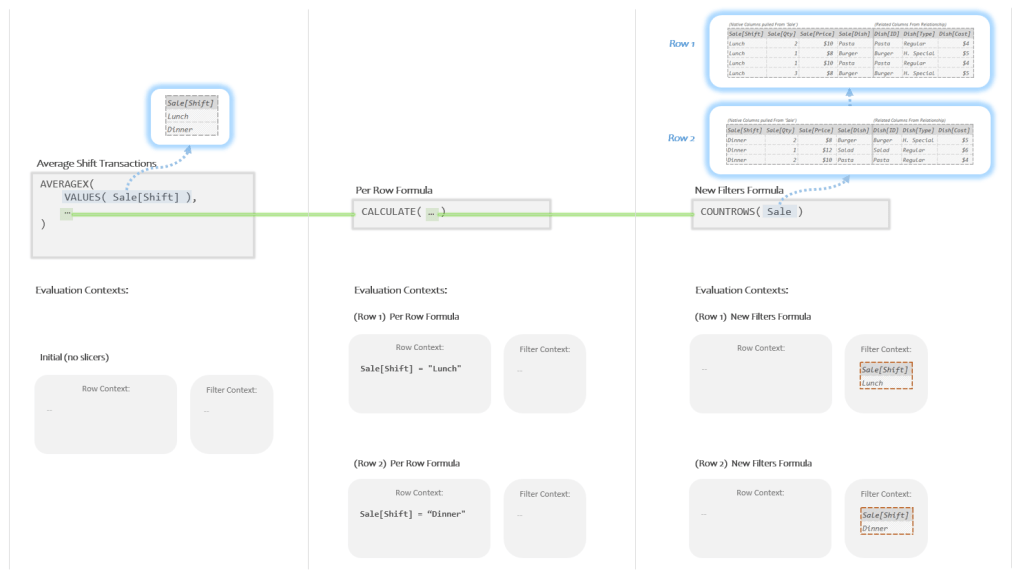
Let’s drawn in the pair of new Evaluation Contexts CALCULATE creates using Context Transition:
For the top row, what was a Current Row Value of “Lunch” is now a “Lunch” filter.
For the bottom row, what was a Current Row Value of “Dinner” is now a “Dinner” filter.
Each time, the contents of the Row Context were *transitioned* into the Filter Context.
That’s where we get the rather technical sounding name of “Context Transition”.
All this means that when the New Filters Formula runs for the top row, there will be a filter for “Lunch” in place, and when it runs for the bottom row, there will be a filter for “Dinner” in place.
When that happens we will finally get the results we need:
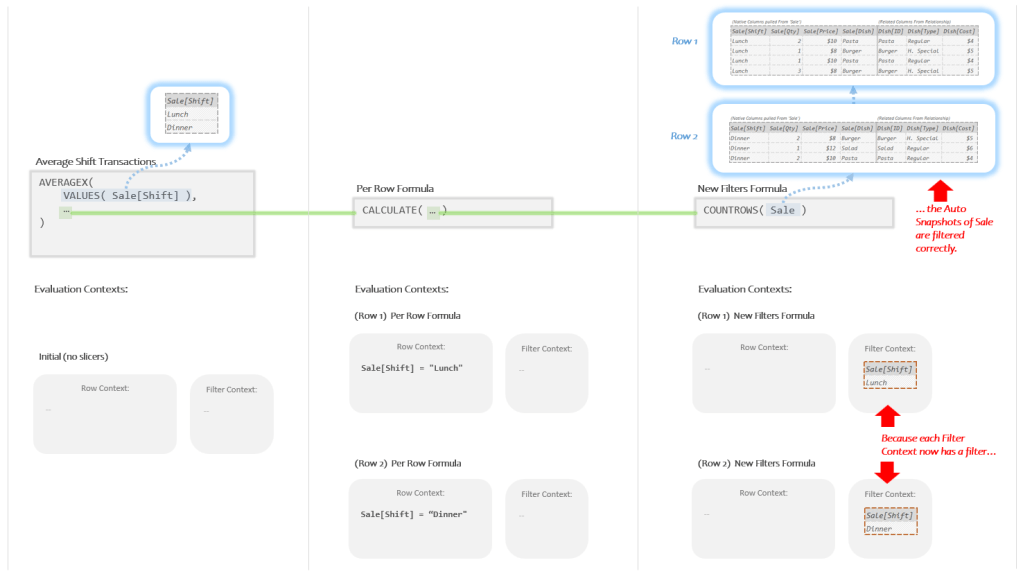
This time when the Auto Snapshot runs for the top row it produces Temp Tables with just the “Lunch” rows and when it runs for the bottom row it likewise produces a Temp Table with just the “Dinner” rows.
When COUNTROWS looks at the first Temp Table, it returns the number “4” (the lunch rows), when it looks at the second Temp Table, it returns the number “3” (the dinner rows).
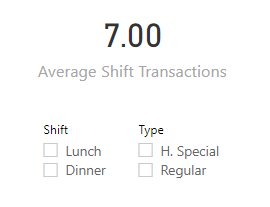
When AVERAGEX gets the numbers “3” and “4”, it averages them together to get the number “3.5”. Which is both the correct answer, and what we see on our Power BI card:

That’s how to get averages like that to work in Power BI. It all revolves around the automatic Context Transition provided by CALCULATE.
Context Transition Up Close
I want to focus on one small section of our decomposition so that we can make sure we really understand what Context Transition just did.
Note the area I’ve got highlighted below:
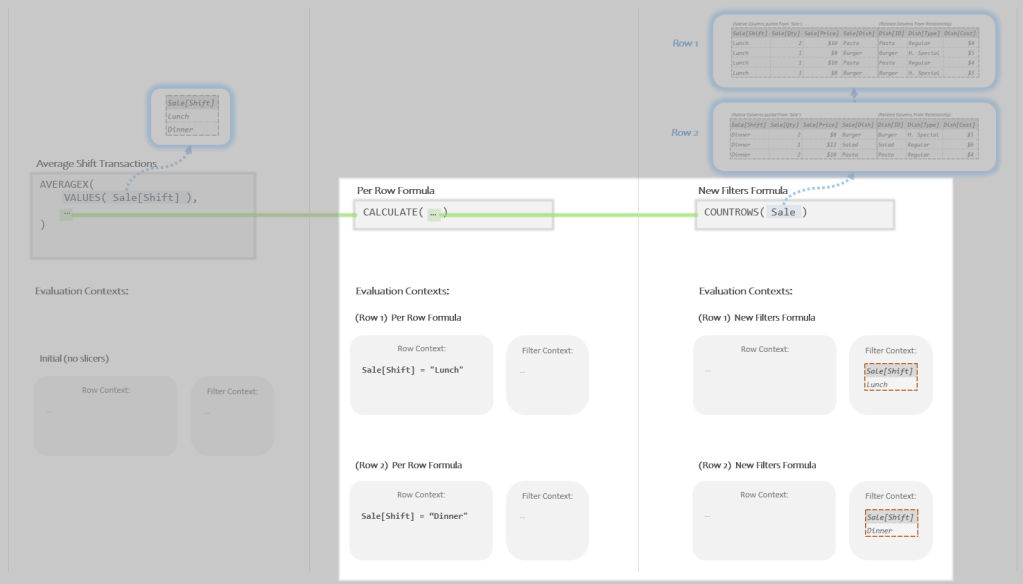
We can see the two sub-formulas and the pair of Evaluation Contexts for each.
Let’s zoom in on that section and focus just on what’s happening with the Evaluation Contexts:
So because the Per Row Formula contains a CALCULATE, that means that two new Evaluation Contexts are going to get built (one for each row). When doing this, the first thing CALCULATE does is take all the values in each Row Context, package them up as a Temp Table, and then migrate them over to the Filter Context.
For the top row the Current Row Value of “Lunch” becomes a filter for “Lunch”.
For the bottom row, the Current Row Value of “Dinner” becomes a filter for “Dinner”.
In our example we didn’t provide any explicit filters (arguments 2+) for CALCULATE to add, but if we did, CALCULATE would have performed Context Transition *first*, and only afterwards would it have added any filters we defined in arguments 2+.
If you are worrying that this is going to be a nightmare to keep track of, it’s actually not that bad and mostly just takes a little practice.
While you do have to *understand* Context Transition, you don’t actually have to *worry* about it all that often. The only time it comes into play is when you are writing Per Row Formulas AND you need to use the values of each row as filters. I certainly wouldn’t call it rare, but it is a pretty specific scenario that you can spot fairly easily if you know how to look.
This however, brings us to our final section…
The Iterator’s Dilemma
Whenever you write a Per Row Formula you almost always want to do one of two things:
(1) Use the values of each row as numbers*
(2) Use the values of each row as filters
Here’s some simple Per Row Formula examples of what “Use the values of each row as numbers” looks like:
▸ Sale[Qty] * Sale[Price]
▸ Appointments[TimeWaiting] + Appointments[TimeWithDoctor]
▸ Shipments[TotalWeight] – Shipments[PackagingWeight]
▸ Employees[BaseSalary] + Employees[BenefitsCost]
▸ Class[StudentCount] / Class[TeacherCount]
Each Per Row Formula contains Current Row References that grab values from the Row Context to be used as simple numbers that get multiplied together, added, subtracted, or divided from each other. These are formulas similar to what you would write in Excel, but instead of cell references like “A1” and “B1”, you have Current Row References like “Sale[Qty]” and “Sale[Price]”. Otherwise it’s basically the same thing.
OK, good. That’s the first kind.
Now here’s some simple examples of what “Use the values of each row as filters” looks like:
▸ CALCULATE( COUNTROWS( Sale ) )
▸ CALCULATE( SUM( Trips[Miles_Traveled] ) )
▸ CALCULATE( MIN( Invoices[InvoiceDate] ) )
▸ CALCULATE( AVERAGE( Customer[Age] ) )
▸ CALCULATE( DISTINCTCOUNT( Employees[EmployeeID] ) )
Each Per Row Formula always starts with CALCULATE in order to transition the values of the Row Context into filters. Then there’s some Auto Filtering function (Auto-Snapshot, SUM, MIN, MAX, AVERAGE, DISTINCTCOUNT, etc.) that takes advantage of the filters that just got added via transition.
To restate:
CALCULATE *transitions* each row’s values to filters
An Auto Filtering function then *uses* those new filters
If you write a Per Row Formula that has an Auto Filtering function (Auto-Snapshot, SUM, MIN, MAX, AVERAGE, DISTINCTCOUNT, etc.) that does *not* have CALCULATE wrapped around it, you’ve probably made a mistake. You need to start with CALCULATE otherwise you’ll get the same answer for each row, just like in the first example of this post.
It’s technically possible within one Per Row Formula to both “use the values of each row as numbers” and also “use the values of each row as filters”, but it’s very, very unusual for new authors. In general, new folks must pick one or the other.
I call this choice The Iterator’s Dilemma. When starting to compose a Per Row Formula, before typing a single thing, you need to take a moment to ask yourself:
“Do I want to use each row’s values as numbers or as filters?“*
If it’s the latter, the very next thing you should do is type CALCULATE in order to perform Context Transition. If you forget, you will always get the wrong answer. If you remember, the rest is easy.
*I use the term “numbers” here, for the more technical folks the term I should use is “scalar”. This is another word that sounds more complicated than it is. “Scalar” describes any simple single value; a number, a text string, a date/time value, a true/false value; those are all scalars. Basically, anything that you might find in an Excel “cell” is a scalar. This is as opposed to Temp Tables (also called “Table Values”) which are technically themselves values, but since they are values that can hold other values inside of them, they are not considered “scalars”. So the fancier version of the Iterator’s Dilemma is: “Do I want to use each row’s values as scalars or as filters?“
Wrapping Up
There’s some more stuff I want to show you around Context Transition, but while this example is fresh in our minds I first want to pivot (if you’ll excuse the data pun) to start building a much, much better understanding of what Measures are and how they work. They are more related to what we’ve talked about than you might think.
Before I leave you though…
I want you to take one last long look at the finished decomposition from our working Measure:
Take your time and walk through what’s happening in there; it’s going to come up again in the next post and so it’s really important that you understand it deeply.
Got it? OK good. I’ll see you next time!
-BG
Post Script: A Quick Note
You might rightfully be wondering why AVERAGEX doesn’t just put “Lunch” both in the Row Context AND in the Filter Context? This way you could skip using CALCULATE to perform this awkward Context Transition thing.
The reason is that Context Transition is expensive: in order to move the values from the Row Context into the Filter Context, they must be packaged up as Temp Tables which takes time.
When iterating over a small Temp Table of, say, 200 rows, this is not a big deal; when iterating over a Temp Table with 200,000,000 rows, this can really slow things down. Therefore DAX requires you to use the CALCULATE function in your Per Row Formula to say “yes, I know it will take extra time, but I really need you to repackage each row as a filter; it’s required for what I’m doing.”
Also, techniques do exist for disabling Context Transition with the REMOVEFILTERS functions; however it is rare that you will need/want this. Perhaps a topic for a future post.
