
In the previous post in this series, we learned about the Auto Snapshot and the several steps DAX executes when performing it.
Quickly, if a function is expecting you to give it a Temp Table as an argument and you give it a Model Table instead (by typing the name of a table in your Data Model), then DAX does the conversion from Model Table to Temp Table for you in a three step process I call The Auto Snapshot.
First, The Simple Copy creates a full copy of the original table; then, The Super Lookup (aka “Table Expansions”) adds all the columns from any Related tables; and finally, Auto Filtering takes all the filters from things like slicers and filters the table down to just the expected rows.
The Temp Table that is produced is *based* on the original table but is both wider than the original (because of all the related columns that got added during the Super Lookup ) and shorter than the original (because of the rows that got removed during Auto Filtering.)
At this point, all this may feel academic. Sure, this is all done to allow the filtering from things like slicers to work as expected, but what is the value in taking the time to understand this concept and maybe more importantly, learn how to visualize it?
The short answer is that there are several instances where those extra columns from the Super Lookup get used in DAX for things other than Auto Filtering, and if you can visualize them properly, what otherwise seems like pure magic in DAX is perfectly logical and maybe even obvious.
We’re going to look at two examples. In this one we will start with the one that is far more common, using the RELATED function. However simple you think this function is, I hope you will see it is even easier.
With that, let’s get to it.
What Is All This Gonna Cost?
As a quick reminder, here’s what our Data Model looks like again:
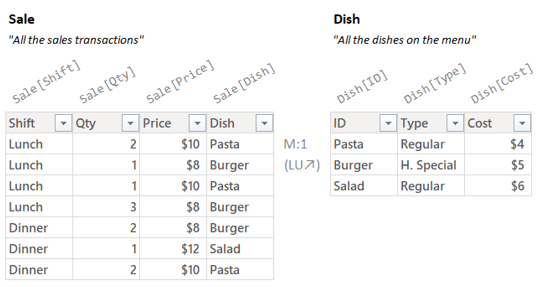
In the last post we were focused on a Measure that counted sales transactions. Let’s shift to something slightly more complicated. Imagine we now want to create a Measure that tells us about total cost.
That is to say, if we know (from the Sale table) for each sales transaction what kind of dish the customer ordered and how many they ordered, and we also know (from the Dish table) how much it costs us to produce each dish, then we should be able to calculate our total cost. Right?
We absolutely can write a Measure like this. In fact, I already have.
Here’s what the working Measures looks like on a Power BI page with nearby slicers set to “Lunch” and “H. Special” (the same slicers as our last post):

Great. So what does this Measure for Total Cost look like? It looks like this:
Total Cost =
SUMX(
    Sale,
    Sale[Qty] * RELATED( Dish[Cost] )
)
Before we’ve covered that SUMX is an Iterator. So, like all Iterators, you have to give two things: a Temp Table and a Per Row Formula. It then runs the Per Row Formula for each row of the Temp Table; taking the results for all the rows and summing them up.
Let’s focus on the just Per Row Formula. For most Iterators (including SUMX) argument 2 is where you type in the Per Row Formula.
Let’s pull out just the Per Row Formula (line 4) from above:
Sale[Qty] * RELATED( Dish[Cost] )
That’s the formula that we are telling DAX to run for each row of some table.
What table though? It’s the table from argument 1, where I typed out “Sale”.
Before I show you the right way to envision things, let me start by showing you the wrong way.
Seeing Things the *Wrong* Way (Booo!)
Just like in the first post, it’s temping to see “Sale” in your code and (incorrectly) imagine the Model Table with that name:

With that imagine in your head let’s consider our Per Row Formula:
Sale[Qty] * RELATED( Dish[Cost] )
OK, so in our incorrect way of thinking, that formula will run once per row of the table I’ve drawn just above it. How does that work?
The reference to Sale[Qty] at least seems plausible. OK, sure, for each row we get the value from the second column. But what about RELATED( Dish[Cost] )? What in the world does that do?
Also, what about the filters from the slicers? We had a filter for “Lunch” and a filter for “H. Special”. I can see how the filter for “Lunch” can filter the table above, but what about the filter for “H. Special”?
It’s technically possible to visualize all the above if you look at the whole Data Model and not just the “Sale” table. But it get’s complicated quickly and involves keeping track of how the relationship between the tables affects filtering. At best it kinda works, sort of.
OK, enough looking at things the wrong way, let’s look at them the right way.
Seeing Things the Right Way (Huzzah!)
First, let’s put aside our specific Measure for a minute and look at what the SUMX function wants in general for us to give it as arguments. Specifically, I want to focus on argument 1.
SUMX(
    <Temp Table>,
    <Per Row Formula>
)
For argument 1, SUMX wants a Temp Table. It does *not* want a Model Table.
What happens when a function wants a Temp Table and you give it a Model Table instead?
That’s right! The Auto Snapshot.
What are those steps again? The Simple Copy, the Super Lookup, and Auto Filtering.
Here’s the whole Auto Snapshot process illustrated:
(Since the filters are the same as in the last post, the result is also the same as the last post.)

While all of the above is interesting, the only bit SUMX is going to care about is the Temp Table that pops out at the bottom, because that’s what DAX hands SUMX to work with:
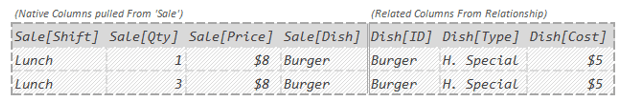
Looking at the above table, if I asked you how to calculate the total cost for each row you’d probably say:
“Hmm, I’m pretty sure for each row you multiply the number in the Sale[Qty] column times the number in the Dish[Cost] column.”
And you’d be right! Furthermore, that’s exactly what our Per Row Formula does:
Sale[Qty] * RELATED( Dish[Cost] )
The only twist is that since Dish[Cost] is one of the columns that was added during the Super Lookup, it’s considered a “Related” column and we have to wrap the column name in the RELATED function. (I’ll get into the “why” in a bit.)
So what does running the Per Row Formula here actually look like?
Iteration: One Row At a Time
Let’s try to visualize SUMX taking the Temp Table, running the Per Row Formulas for each row, and a finally summing up the results:

OK, so there’s a lot going on. Right now, the big thing that I want you to see is the Per Row Formula appears identically for each row (just to the right of the table in dark yellow text).
The same formula runs “once per row”. When it runs for the first row it produces the number $5, and when it runs for the second row it produces the number $15. Let’s look at each row in isolation to better understand where those numbers are coming from.
We’ll start by focusing on just the Per Row Formula running for the *first row*; paying close attention to what the references are pointing to:
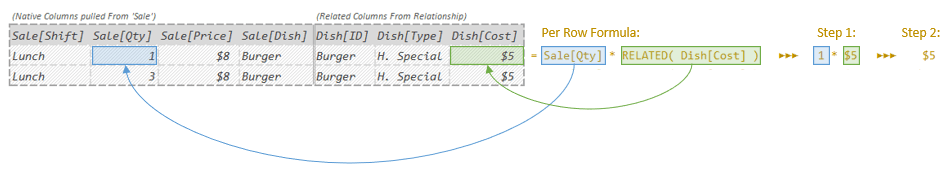
The reference to Sale[Qty] tells DAX to go look in the current row for a column with the name Sale[Qty] and bring back its number. It looks to the left and finds the number 1.
The reference RELATED( Dish[Cost] ) tells DAX to go look in the Related columns section of the current row for a column with the name Dish[Cost] and bring back its number. It looks to the left and finds the number $5.
(For folks who have read some of my previous posts, these are both examples of Current Row References, where you say “I want to use the value of *that* column in the current row.”)
Our Per Row Formula has a “*” between the references, telling DAX to multiply those numbers together to get $5, the total cost for the first row.
Good. Now let’s look at the second row:

The reference to Sale[Qty] tells DAX to go look in the current row for a column with the name Sale[Qty] and bring back its number. It looks to the left and in this row, it finds the number 3.
The reference RELATED( Dish[Cost] ) tells DAX to go look in the Related columns section of the current row for a column with the name Dish[Cost] and bring back its number. It looks to the left and finds the number $5.
Our Per Row Formula has a “*” between the references, telling DAX to multiply those numbers together to get $15, the total cost for the second row.
So now that SUMX has run the Per Row Formula for each row, what does it do with those two numbers? It sums them up:
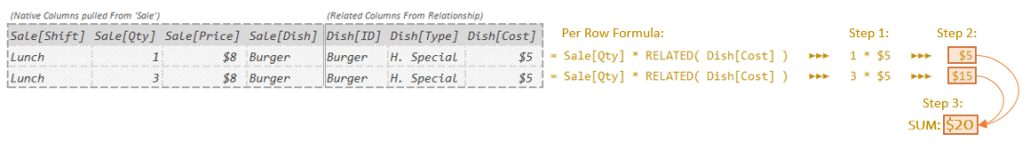
The sum of $5 and $15 is $20. That’s our final answer.
(The only difference between the different Iterators is what it does with the numbers it gets from running the Per Row Formula for each row. SUMX sums them up, AVERAGEX takes their average, MAXX takes the max, etc.)
So what does the RELATED function do? RELATED just says:
“I want you to go look for a value in the current row, but when you do, you’ll need to look within the Related columns section to do it. That’s because the column I want to get a number from was one of the ones brought in during the Super Lookup.”
Why is this Important? Let’s Rewind.
Let’s imagine I rewind all the way back to the very, very beginning and imagine I just got asked to write a Measure that calculates total cost.
So I go into Power BI and create a Measure and name it Total Cost.
OK, now all I’ve got is a name and a blinking cursor:
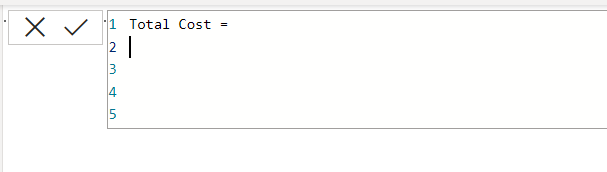
How in the world do I go about writing this Measure?
Where do I even start?
The first thing I’m probably gonna think is:
“This relates to transactions, so what does the Auto Snapshot of Sale look like?”
If I can then get some version of the following image to pop up in my head:

Just like that, I can see that everything I need is right there in that one single, simple, clean, uncomplicated, Temp Table.
“For each row multiply Sale[Qty] by Dish[Cost] and sum up the results; easy.”
I know the Dish[Cost] column is a Related column so I’ll have to wrap the column name in RELATED, but otherwise I can grab SUMX and knock the whole thing out in a couple seconds:
Total Cost =
SUMX(
    Sale,
    Sale[Qty] * RELATED( Dish[Cost] )
)
By contrast, if when starting out, I say:
“This relates to transactions, so what does Sale table look like?”
and I got to the Data Viewer in Power BI and just stare at it:
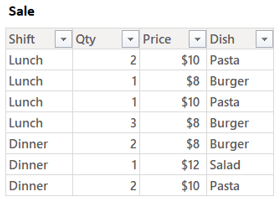
I can see quantity but not cost. Now the problem feels much harder than it is.
I can try to remember that Sale has a Relationship with Dish and so I can use this RELATED function to go pull in the value from the other table for each row. This isn’t impossible, I did it for years. It’s simply much harder and error prone than starting with the right image in your head:

If I can see that when I start, like I’ve trained myself to do almost reflexively; what comes next is obvious and takes 10 seconds to write. If you want DAX to be one of your core skills, this is worth getting good at.
Often simply asking the question “What would the Auto Snapshot give me?” is enough to solve a surprising number of DAX needs without effort. Yeah, getting good at it is hard. Once you can do it though, you can spot answers in seconds that takes other people (people who are smarter than you) days.
Why Does DAX Require RELATED?
Let’s go back to our Measure:
Total Cost =
SUMX(
    Sale,
    Sale[Qty] * RELATED( Dish[Cost] )
)
So why does DAX require the REALTED function? If we imagine argument 1 above as the Temp Table from the Auto Snapshot of sales:
Why not just write a Per Row Formula like:
Sale[Qty] * Dish[Cost]
Where for each row you multiply the row value for the Sale[Qty] column times the row value for the Dish[Cost] column? Both columns exist in the Temp Table, why require a silly RELATED function around the second one?
The is just my opinion, but I’m pretty sure this is because is that when most people see “Sale” written in the measure they don’t correctly envision the Temp Table that you see above. They incorrectly (though understandably) envision the Model Table called “Sale”:
Just like we talked about earlier, thinking about a Per Row Formula for the above table that referenced a “Dish[Cost]” column is confusing for most folks because the incorrect image in their head doesn’t have a “Dish[Cost]” column. So, as not to confuse folks, DAX requires you to use this RELATED function with a story about it looking up values across relationships.
So is this requirement to use RELATED is mainly so people don’t get confused?
As best as I can tell, yes. They could have not required it, and to the best of my knowledge they could turn off this requirement tomorrow and everything would work just fine.
(In the next post we’ll look at a function called GROUPBY that also lets you use these Related columns of a Temp Table but doesn’t require you to use the RELATED function when typing out the column names. In other words: DAX requires you to use RELATED in some places but does not require it in others.)
You might be thinking at this point that I consider this requiring of the RELATED function design a mistake on the part of the folks who designed DAX; however I very much do not.
Most people are not going to learn the very tricky concepts contained in this blog series (or anywhere else), so I think it’s good that DAX works this way. The way it is set up now makes more sense to casual users. Which, going back to the first post in this series, should be the goal of any self service language. It needs to just work for casual users without hours of research and reading obscure multi part blog posts.
Note though, that because *you* can properly envision the Auto Snapshot, you can learn a much simpler story with quite a bit less hand waving. There is no magic “and then it just works” in the version you have learned; you write a Per Row Formula, and if you want to use any of the columns in the Related section, you just wrap the name of the column in the RELATED function.
(One big big last thing I can’t stress enough: If you are in a class, and they are teaching things not this way, please do not interrupt the class to ask about the concepts as I’ve explained them. At most you’ll confused everyone else in the class who has not read these articles. Most classes are designed to get folks “up and running” with DAX quickly, and avoid front-loading a lot of the trickier concepts that I’ve covered here. In these classes it’s worth hearing the other way of understanding things, and just being satisfied that you’ve done the work that lets you understand things in the simpler way.)
Still not convinced of the benefit of visualizing the Auto Snapshot? I’ve got another example that I think might help.
That’s next time though!
-BG
Post Script: The Model Table Reference
It’s always tricky to know exactly how much terminology is too much in a given post. There’s lots of places where I feel like I want to introduce a more formal term, but when I do so it totally destroys the flow of the content. I’ve lost so many hours to writing out a big long explanation, only to determine that even though the explanation itself is excellent, it destroys the flow of things and has to go. As they say, in writing you spend much of your time killing your darlings.
That said, there’s a term I want to introduce here.
In my posts I will say things like “we give the function a Model Table”, which is to say, we type out the name of one of the tables in our Data Model.
My term for when you type out the name of a table in your Data Model is a Model Table Reference.
This can also be shortened to just Table Reference which (in DAX) is another term for the exact same thing. In DAX a “Model Table Reference” is not a more specific kind of “Table Reference”, the name is just more descriptive (at the cost of requiring more typing).
So in our example:
Total Cost =
SUMX(
    Sale,
    Sale[Qty] * RELATED( Dish[Cost] )
)
Line 3 is a Model Table Reference. It is pointing to a table in the Data Model and saying “I want you to go use this thing”. Because SUMX has no clue what to do with a Model Table, DAX performs the Auto Snapshot to create a Temp Table like SUMX wants.
We could also just call what’s in line 3 a Table Reference, omitting the “Model” bit. That’s still absolutely accurate, it is indeed pointing to a table. This is what it’s called by most folks.
I prefer the wordier version however, because I think it helps folks remember what *kind* of table they are referring to. Maybe more importantly it also emphasizes the idea that there are different kinds of tables in DAX and it’s important to know when you say “table” what kind you are talking about.
Similarly, whenever you type out the name of a column it is a Column Reference. What’s slightly trickier with Column References, is that unlike Table References (which always point to Model Tables), Column References can point to one of three different *kinds* of things (Model Columns, Temp Columns, and Current Row Values). For more info on that, check out my previous series of posts here.
