
In the previous two posts we learned about the two most common kinds of column references in DAX, the Current Row Reference, and the Model Column Reference.
In this post I’m going to both focus on why this so frustrating for new DAX authors, and also spend some time helping you be able to start to envision these effects when you look at your own code.
Can You Spot The Difference?
OK, let’s look at our formula again:
Biggest Order Surplus =
MAXX(
    VALUES( Sale[Qty] ),
    Sale[Qty] - 1
)
The reference Sale[Qty] appears two times.
The first time, since it is an argument for VALUES, it is a Model Column Reference. It is specifying which column in the Data Model to take the values of.
The second time, since it is *not* used in a special function like VALUES or ALL, it is a Current Row Reference. It says “go look in the current row for a number called Sale[Qty] and get it.”
New authors tend to feel something is different about the two references in formulas above; but precisely “what is different” is a mystery and tends to remain so for years and years.
This might seem like a triviality but it’s actually quite important. When a new DAX authors sees a column reference like Sale[Qty] in their code what are they are they supposed to envision? A whole column, or just a single number? The answer is “it depends”, but for a new DAX author “it depends” might as well be “you can never know for sure so don’t bother trying to understand any of it because DAX hates you”.
(DAX does not hate you by the way, I promise)
Writing good code requires you to have a good mental model of what objects you are working with and what you are asking to do with each of them. Having a single term change meanings from line to line almost has the effect of gaslighting authors:
“I swear Sale[Qty] was a whole column, but then I think a few minutes later it was a single number, but then later on it was a whole column again; which is it? WHICH IS IT?!?”
Me (9 years ago)
It’s very hard for authors to build a good mental model of what their code is doing if the language is causing the ground to constantly shift underneath their feet like this.
There are several very good reasons DAX is designed this way. It makes writing DAX easy for casual users who don’t need to deeply understand things. Let me repeat, this is not a bad design choice on the part of DAX; like all design decisions howver, it comes with tradeoffs.
Love it or hate it though, to work with DAX well, you have to learn to distinguish between these different kinds of references as if it were second nature.
The good news comes in the form of the rule we saw in the first post:
Any column reference in DAX is always a Current Row Reference unless it is being made as an argument of functions that requires one of the other types (Model Column Reference, or Table Column Reference.)
Again, the big two functions that use these are VALUES and ALL. But here’s a slightly longer list so you can get a sense of what these look like:
VALUES
ALL
REMOVEFILTERS
ALLSELECTED
DISTINCT
ISFILTERED
ISINSCOPE
DATESYTD/QTD/MTD
SAMEPERIODLASTYEAR
CLOSING/OPENINGBALANCE
(and all the other Time Intelligence functions)
The full list is longer than this, but if you can learn the concept, and memorize the first two items on the list, then you are setting yourself up for success.
Can You Actually See It Though?
So let’s think back to our measure:
Biggest Order Surplus =
MAXX(
    VALUES( Sale[Qty] ),
    Sale[Qty] - 1
)
When we execute that with slicer set to Lunch; here’s all the stuff that happens:
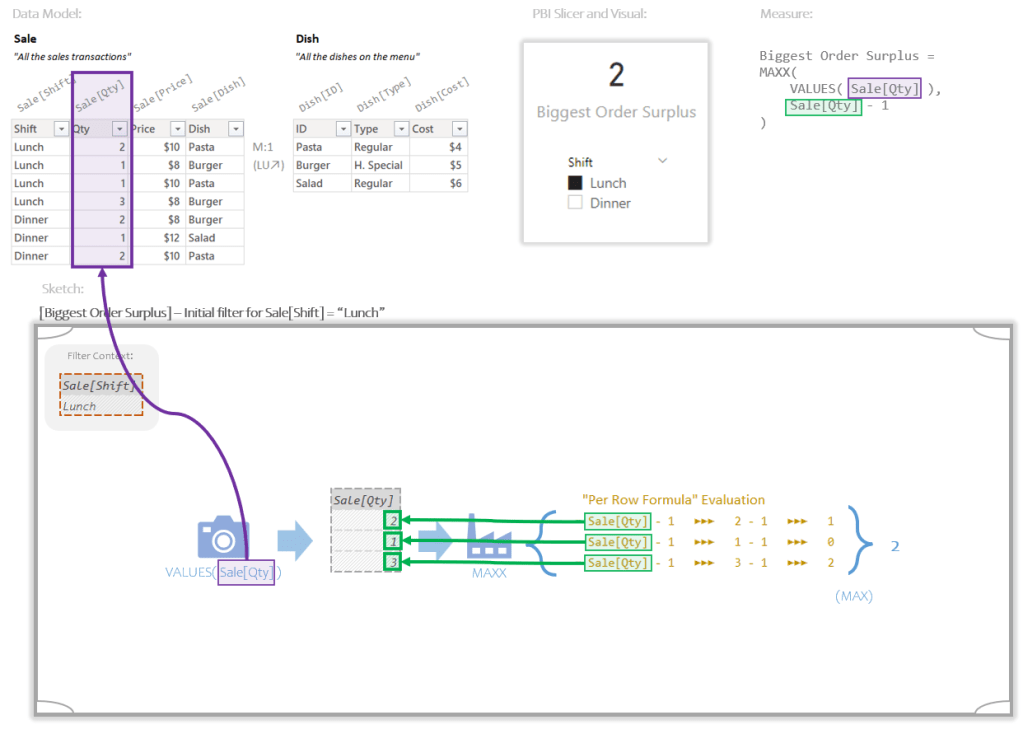
If you are thinking that there’s no way you can look at a bit of code and just draw that in your head you are absolutely right. There’s way too much detail involved; and what do you do when working with real data with millions of rows?
What I want you to work towards though is (maybe three months from now) being able to read the above code and automatically envision something like this:
In your head you wont see the text bits, but you’ll *feel* the information living in each box. What you’ll see is the boxes and maybe the arrows.
This is much closer to what I see in my head when working with code. Being able to see it in my head like this is what allows me to fairly easily work with large formula with lots of pieces. The human brain is great at tracking and manipulating large numbers of objects in imaginary 2D space. When you can start to see DAX in this way (especially at scale), most of the difficulty of the language starts to disappear.
Awesome, Sounds Impossible
I get it. This feels overwhelming. It’s a skill though. You start slow and you speed up one day at a time.
How to practice though? Let’s walk through our example.
Here’s our code:
Biggest Order Surplus =
MAXX(
    VALUES( Sale[Qty] ),
    Sale[Qty] - 1
)
So when you see:
VALUES( Sale[Qty] )
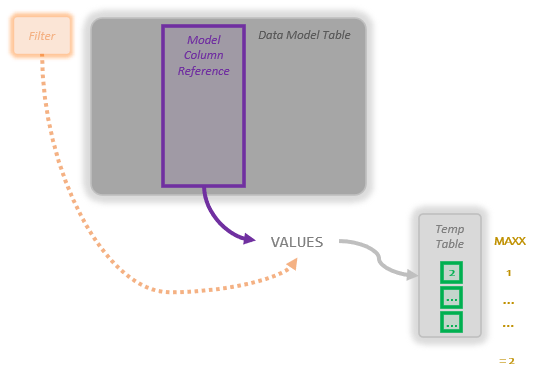
Your eyes see the reference to Sale[Qty] and you should ask “is the reference in either VALUES or ALL?” The answer here is yes, and that means the reference is a Model Column Reference, and the whole thing is a Snapshot.
With VALUES you need to envision three things:

The dark rectangle high up is a table in the Data Model.
The purple highlighted bit, is the reference to the single column we’re asking VALUES to make a copy of.
The thin light gray rectangle down below the other stuff is the Temp Table VALUES creates. It’s only one column wide, and it has had duplicates removed and any filters (for say “Lunch”) applied.
If you can see these in your head, great. If you’re new, you probably can’t, so grab a piece of scrap paper and just sketch it out real fast.
With that done, focus on the light grey rectangle.

Try and guess how big it is. Don’t worry about coming up with the right answer, just guess.
Maybe, 1 column wide and about 3 rows tall? Why not.
Do not check your answer when done. Getting the answer correct here is *not* the point, the act of guessing is the point; or more accurately we’re trying to practice *feeling* how big it is.
In real life the data won’t be so small, but guesses like “3 or 4 columns by a couple hundred rows” is plenty good; and this would feel like a very thin, but very tall rectangle.
Now we can move on to the Iterator part with MAXX:
MAXX(
    VALUES( Sale[Qty] ),
    Sale[Qty] - 1
)
OK, we just saw the Temp Table created for argument 1, now let’s focus on the argument 2, the Per Row Formula:
Sale[Qty] – 1
The Per Row Formula has a references to Sales[Qty], but is it being made in either VALUES or ALL? Nope, it is not. So based on our rule of thumb, this is a Current Row Reference.
So the above Per Row Formula going to run for each row of the Temp Table. And for each row, the first thing that happens is that a Current Row Reference of Sale[Qty] will get the quantity for just that row.
How do we envision that?
We start by just seeing the Temp Table with a little pointer for where the number we will get for each row might live:

Don’t try and get the number of green rectangles correct, just imagine a bunch of them running down the middle of the rectangle.
Now zoom in in just the top row. Try to guess a number that might make sense there. Again, don’t go look in the real Data Model, or try to find the right answer. Just any number that might make sense. This is a table of quantities sold, when I go to the store I get maybe 1 or 2 of a given thing. Great, let’s just pick 2, close enough.
So for the first row we are going to imagine 2, and then just off to the side we’ll imagine the final result for that row. If we subtract 1 from 2, we end up with 1.

Don’t try to fill in the other rows. The first one is just fine. We only need to think through what the Per Row Formula gets for a single row most of the time.
Lastly we zoom out a little bit and imagine that the Per Row Formula has been run for each row, but we don’t worry trying to see in to those boxes, we let them be fuzzy and out of focus. We just see a bunch of blips that are all the answers. Knowing what we know about the data, what’s a good guess as to what the biggest number might be? I dunno, 2 to 4 maybe? Let’s guess 2, that’s the max and the final answer:
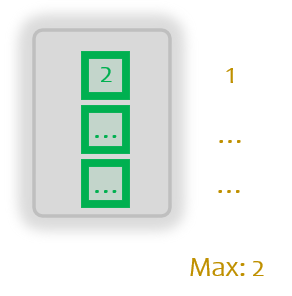
No need to zoom back out and try to see the whole thing. If you made it through that, even barely, you did all the work you need to do.
I feel like a broken record here, but your guess as to the final answer does not have to match what the measure produces. The goal is to think through the process while drawing it out in your head.
One Foot In Front Of The Other
The idea is to get the brain to realize it needs to start thinking in this way, and if needed, help it along by drawing what you want it to see on the nearest piece of paper. (And throwing away the work as soon as you are done.)
You shouldn’t have to practice this much, but if you do it just a little bit you’ll get your brain to start practicing it for you in the background. Hopefully in time, what takes huge amount of effort will become second nature.
DAX formulas can contain more complex things than what we’ve got here. But honestly a huge chunk of DAX, is just envisioning a larger number of the things we’ve seen here. DAX is simple, much simpler than you think. I hope you can start seeing it soon.
